perf 命令详解
|
选择喜欢的代码风格
A B C D E F G H I J K L M N O P Q R S T U V W X Y Z
perf 是一个 Linux 性能计数器测量框架,基于 Linux 2.6 + 系统的分析工具,它抽象了在 Linux 中性能度量中 CPU 的硬件差异 ,提供一个简单的命令行界面。Perf 基于最新版本 Linux 内核的 perf_events 接口。
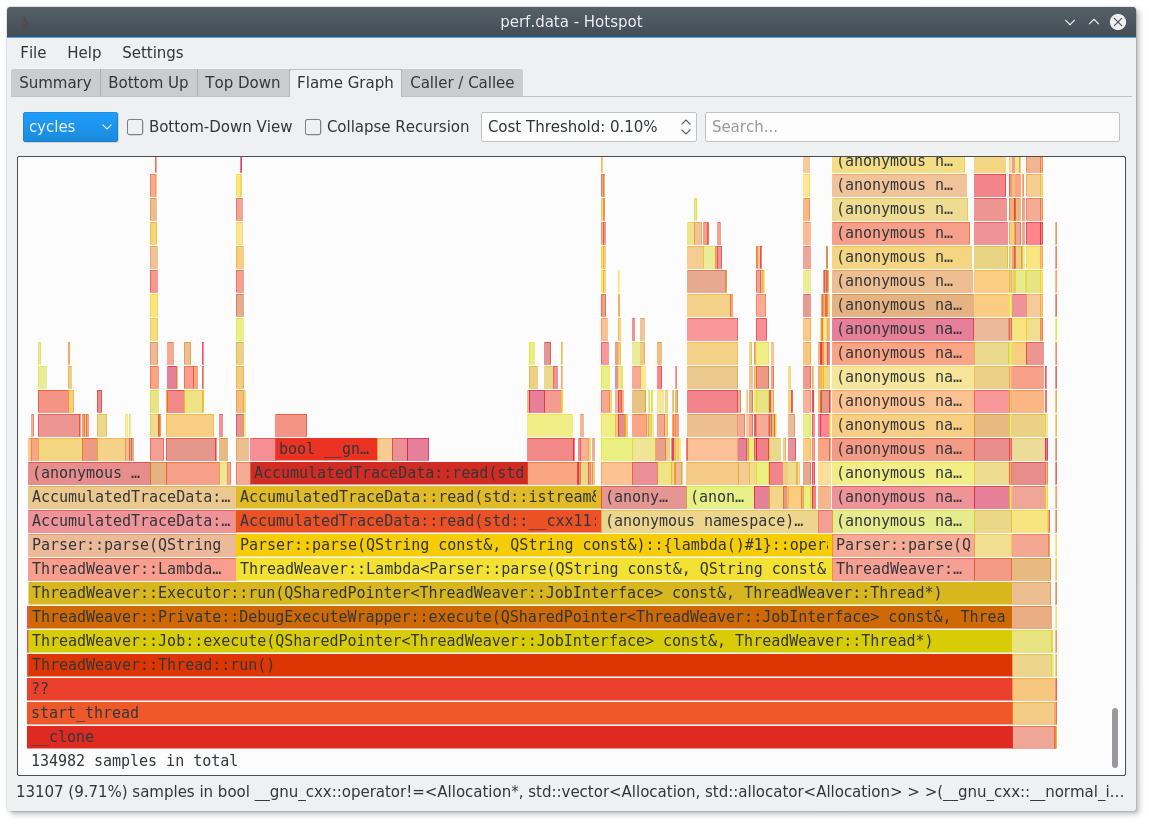
perf 火焰图
perf 命令安装:
-bash/zsh: tc: command not found

#Debian
apt-get install perf

#Ubuntu
apt-get install perf

#Arch Linux
pacman -S perf

#Kali Linux
apt-get install perf

#CentOS
yum install perf

#Fedora
dnf install perf

#Raspbian
apt-get install perf
perf 命令补充说明:
perf 是 Linux 下的一款性能分析工具,能够进行函数级与指令级的热点查找。它由一个叫 Performance counters 的内核子系统实现,基于事件采样原理,以性能事件为基础,支持针对处理器相关性能指标与操作系统相关性能指标的性能剖析,可用于性能瓶颈的查找与热点代码的定位。
perf 命令语法:
perf [--version] [--help] COMMAND [ARGS]
perf 命令选项:
-h, --help
Run perf help command.

-v, --version
Display perf version.

-vv
Print the compiled-in status of libraries.

--exec-path
Display or set exec path.

--html-path
Display html documentation path.

-p, --paginate
Set up pager.

--no-pager
Do not set pager.

--buildid-dir
Setup buildid cache directory. It has higher priority than buildid.dir config file option.

--list-cmds
List the most commonly used perf commands.

--list-opts
List available perf options.

--debugfs-dir
Set debugfs directory or set environment variable PERF_DEBUGFS_DIR.

--debug
Setup debug variable (see list below) in value range (0, 10). Use like: --debug verbose # sets verbose = 1 --debug verbose=2 # sets verbose = 2

List of debug variables allowed to set:
  verbose          - general debug messages
  ordered-events   - ordered events object debug messages
  data-convert     - data convert command debug messages
  stderr           - write debug output (option -v) to stderr
                     in browser mode
  perf-event-open  - Print perf_event_open() arguments and
                     return value
perf 常用命令:
perf list:  查看当前软硬件环境支持的性能事件
perf stat:  分析指定程序的性能概况
perf top:   实时显示系统/进程的性能统计信息
perf record:记录一段时间内系统/进程的性能事件perf report:读取perf record生成的perf.data文件,并显示分析数据
perf 命令实例:
perf 显示命令的基本性能计数器统计信息:
perf stat gcc hello.c
perf 显示系统范围的实时性能计数器配置文件:
sudo perf top
perf 运行命令并将其配置文件记录到“perf.data”中:
sudo perf record command
perf 阅读 perf.data - 由 perf record 创建,并显示配置文件:
sudo perf report
perf 扩展阅读:
- Linux Perf 性能分析工具及火焰图浅析
- KDAB/hotspot:The Linux perf GUI for performance analysis.
- tc 命令详解
- IP 子网掩码对照速记表
- pidstat 命令
- iostat 命令
- dstat 命令
- vmstat 命令
- mpstat 命令
- dstat 命令
- perf 命令
- ip 命令
- systemd-analyze 命令
- speedometer 命令详解
- nethogs 命令
CommandNotFound ⚡️ 坑否 - 其他频道扩展阅读:
perf 命令评论
系统管理
-
CSS 两边圆形最简单直接的写法
ac 命令
accept 命令
accton 命令
alias 命令
apg 命令
apk 命令
apropos 命令
apt-get 命令
apt-key 命令
apt-sortpkgs 命令
aptitude 命令
arch 命令
as 命令
atop 命令
badblocks 命令
blkparse 命令
blkstat 命令
blktrace 命令
builtin 命令
cancel 命令
cfdisk 命令
chage 命令
chfn 命令
chgrp 命令
chkconfig 命令
chmod 命令
chown 命令
chpasswd 命令
chroot 命令
clock 命令
clockdiff 命令
command 命令
consoletype 命令
crash 命令
denyhosts 命令
depmod 命令
df 命令
dmesg 命令
dmidecode 命令
dnf 命令
dropwatch 命令
dstat 命令
du 命令
env 命令
fc-list 命令
fc-match 命令
fdisk 命令
finger 命令
free 命令
gdb 命令
getent 命令
groupadd 命令
groupdel 命令
groups 命令
help2man 命令
hostid 命令
htop 命令
hwclock 命令
init 命令
ioping 命令
iostat 命令
iotop 命令
iptables 命令
kill 命令
killall 命令
lastcomm 命令
logname 命令
lpass 命令
lsblk 命令
lsb_release 命令
lscpu 命令
lshw 命令
lspci 命令
lsscsi 命令
mdadm 命令
modinfo 命令
modprobe 命令
mpstat 命令
ncdu 命令
neofetch 命令
nproc 命令
nushell 命令
parted 命令
passwd 命令
perf 命令
pgrep 命令
pidof 命令
pidstat 命令
pinky 命令
pkill 命令
pm2 命令
printenv 命令
ps 命令
pstree 命令
pvdisplay 命令
pvs 命令
quota 命令
rbash 命令
reset 命令
rmmod 命令
sar 命令
snap 命令
stty 命令
sudo 命令
systemd-analyze 命令
testdisk 命令
timew 命令
top 命令
tree 命令
type 命令
ulimit 命令
unalias 命令
uname 命令
update-alternatives 命令
uprecords 命令
uptime 命令
vigr 命令
vipw 命令
vmstat 命令
w 命令
whoami 命令
zypper 命令
共收录到 549 个 Linux 命令