dropwatch 命令详解
|
选择喜欢的代码风格
A B C D E F G H I J K L M N O P Q R S T U V W X Y Z
dropwatch 命令用于内核丢包监控。
dropwatch 命令安装:
-bash/zsh: dropwatch: command not found

# CentOS
yum install dropwatch

# Fedora
dnf install dropwatch

# Dockerfile
dockerfile.run/dropwatch
dropwatch 命令补充说明:
dropwatch 命令原理是跟踪 kfree_skb 的调用行为。
说明:有案例报道直接通过 dropwatch -l kas 使用 /proc/kallsyms 符号表,可能会造成宕机,如果碰到可以使用 /boot/System.Map 符号表(隶属于 kernel 包)
数据包收包宏观过程:
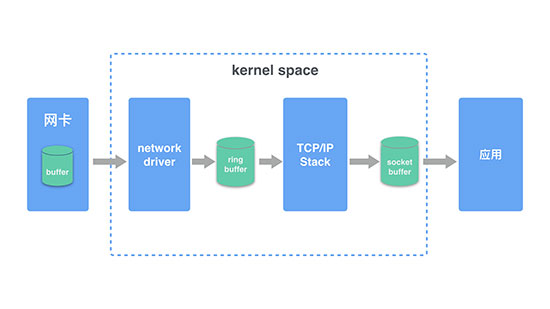
kernel space
- 首先网络报文通过物理网线发送到网卡
- 网络驱动程序会把网络中的报文读出来放到 ring buffer 中,这个过程使用 DMA(Direct Memory Access)将数据包映射到内存中,且不需要 CPU 参与
- 内核从 ring buffer 中读取报文进行处理,执行 IP 和 TCP/UDP 层的逻辑,最后把报文放到应用程序的 socket buffer 中
- 应用程序从 socket buffer 中读取报文进行处理
数据包收包较详细过程:
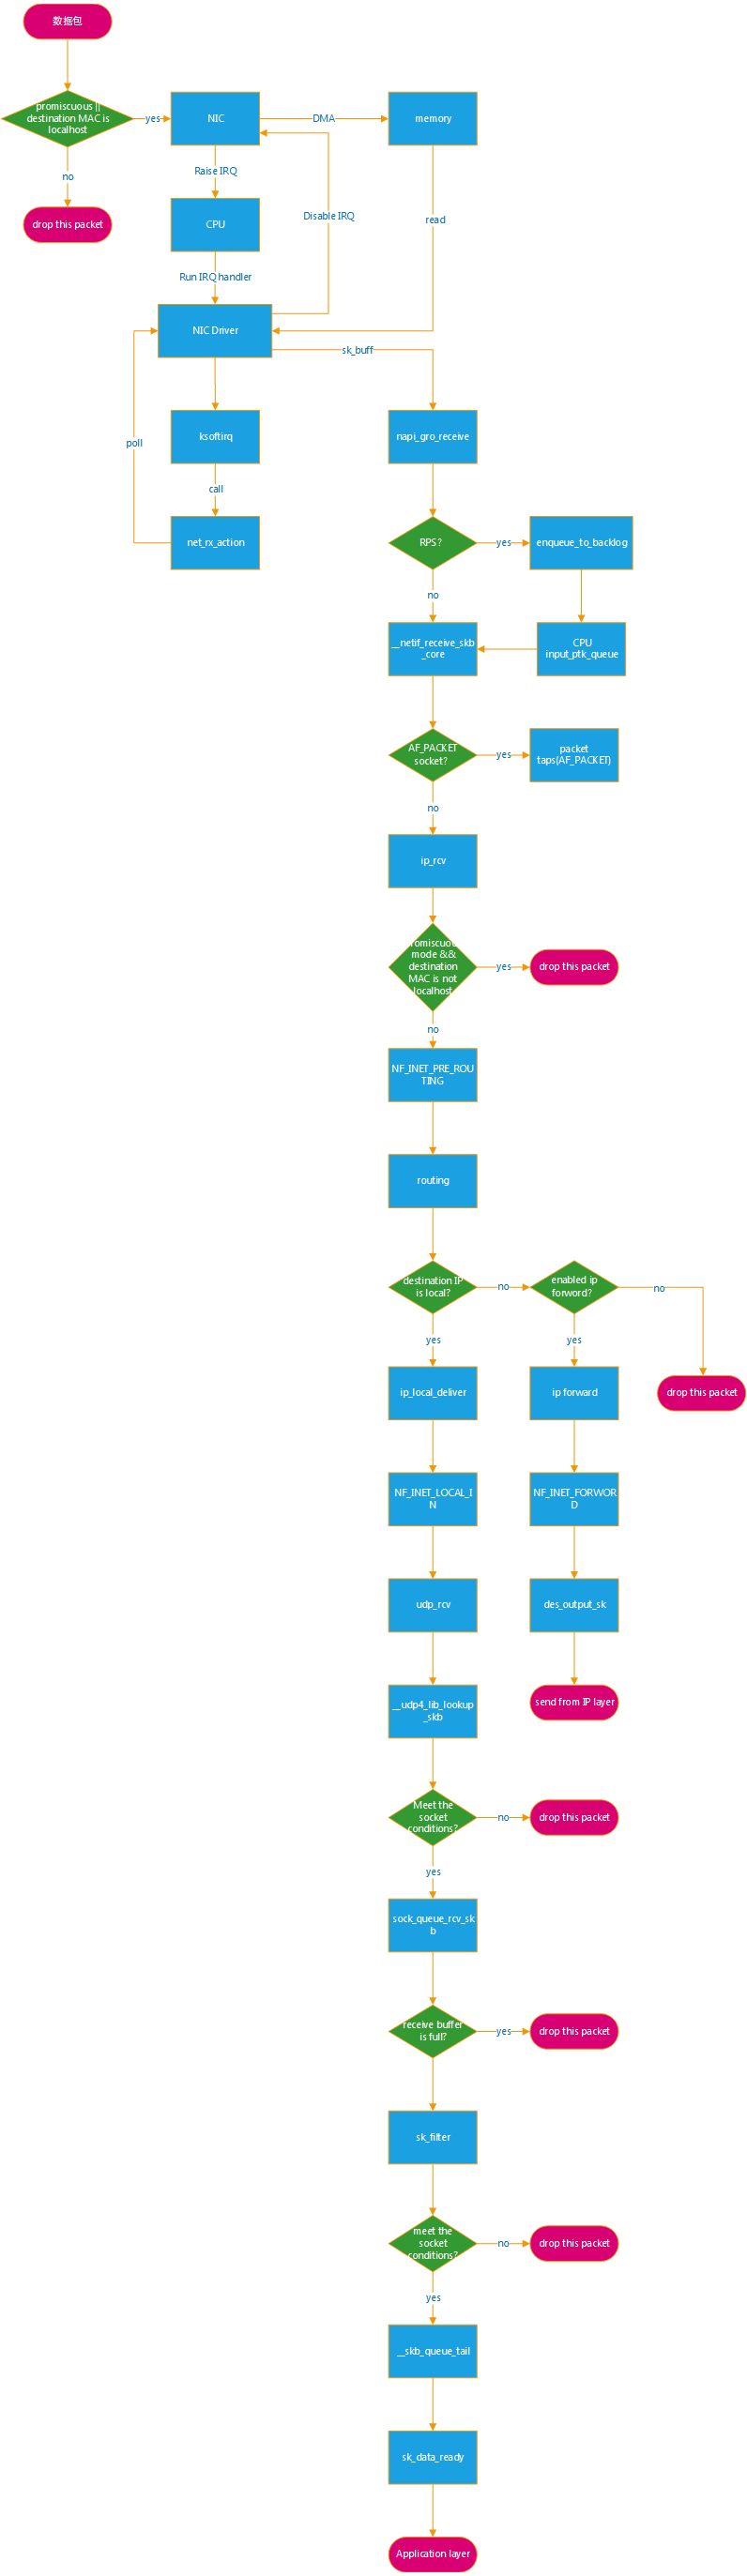
由上,在 Linux 内核网络中,发生丢包可能的地方特别多
dropwatch 命令语法:
dropwatch [-l <method> | list]
dropwatch 命令选项:
===============================
            Options
===============================

-l <method> | list


Select the translation method to use when a drop alert arrives.
By default the raw instruction pointer of a drop location is output,
but by the use of the -l option,
we can assign a translation method so that the instruction pointer can be translated into function names.
Currently supported lookup methods are:

kas - use /proc/kallsyms to lookup instruction pointers to function mappings


===============================
     Interactive Commands
===============================

start
Tells the kernel to start reporting dropped packets

stop
Tells the kernel to discontinue reporting dropped packets

exit
Exits the dropmonitor program

help
Displays summary of all commands

set alertlimit <value>
Sets a triggerpoint to stop monitoring for dropped packets after <value> alerts have been received
dropwatch 命令实例:
使用 dropwatch 前,需要 uname 了解系统的版本,并确保已经安装了对应的包:
uname -r

3.10.0-1160.80.1.el7.x86_64
dropwatch 命令实例:
使用 dropwatch 前,需要 uname 了解系统的版本,并确保已经安装了对应的包:
uname -r

3.10.0-1160.80.1.el7.x86_64
dropwatch 本身有一个交互命令行,命令中的 kas 指的是加载对应的符号表:
dropwatch -l kas


Initalizing kallsyms db

dropwatch> start

Enabling monitoring...
Kernel monitoring activated.
Issue Ctrl-C to stop monitoring
298 drops at init_dummy_netdev+50 (0xffffffff81459d10)
1 drops at init_dummy_netdev+50 (0xffffffff81459d10)
14 drops at init_dummy_netdev+50 (0xffffffff81459d10)
...
dropwatch 显示在 init_dummy_netdev 附近存在大量丢包现象,提示信息格式的大致说明是:丢包数量 drops at 函数名+偏移量 (地址),直接在符号表里搜索:
grep -w -A 10 init_dummy_netdev /proc/kallsyms


ffffffff81459cc0 T init_dummy_netdev
ffffffff81459d10 t net_tx_action
ffffffff81459ed0 T __napi_complete
ffffffff81459f10 T netdev_drivername
ffffffff81459f70 T __dev_getfirstbyhwtype
ffffffff81459ff0 T dev_getfirstbyhwtype
ffffffff8145a040 t unlist_netdevice
ffffffff8145a120 t dev_unicast_flush
ffffffff8145a1d0 t dev_addr_discard
ffffffff8145a260 T __dev_remove_pack
ffffffff8145a310 T dev_add_pack
init_dummy_netdev 的地址是 ffffffff81459cc0,加上偏移量 50 等于 ffffffff81459d10,正好是 net_tx_action 的地址(注:如果计算后的地址在两个函数之间,那么取前者),于是我们得出结论,实际丢包是发生在 net_tx_action 函数中。
dropwatch 的用法稍显复杂,大家可以试试 perf:
perf record -g -a -e skb:kfree_skb
perf script
dropwatch 扩展阅读:
CommandNotFound ⚡️ 坑否 - 其他频道扩展阅读:
dropwatch 命令评论
系统管理
-
CSS 两边圆形最简单直接的写法
ac 命令
accept 命令
accton 命令
alias 命令
apg 命令
apk 命令
apropos 命令
apt-get 命令
apt-key 命令
apt-sortpkgs 命令
aptitude 命令
arch 命令
as 命令
atop 命令
badblocks 命令
blkparse 命令
blkstat 命令
blktrace 命令
builtin 命令
cancel 命令
cfdisk 命令
chage 命令
chfn 命令
chgrp 命令
chkconfig 命令
chmod 命令
chown 命令
chpasswd 命令
chroot 命令
clock 命令
clockdiff 命令
command 命令
consoletype 命令
crash 命令
denyhosts 命令
depmod 命令
df 命令
dmesg 命令
dmidecode 命令
dnf 命令
dropwatch 命令
dstat 命令
du 命令
env 命令
fc-list 命令
fc-match 命令
fdisk 命令
finger 命令
free 命令
gdb 命令
getent 命令
groupadd 命令
groupdel 命令
groups 命令
help2man 命令
hostid 命令
htop 命令
hwclock 命令
init 命令
ioping 命令
iostat 命令
iotop 命令
iptables 命令
kill 命令
killall 命令
lastcomm 命令
logname 命令
lpass 命令
lsblk 命令
lsb_release 命令
lscpu 命令
lshw 命令
lspci 命令
lsscsi 命令
mdadm 命令
modinfo 命令
modprobe 命令
mpstat 命令
ncdu 命令
neofetch 命令
nproc 命令
nushell 命令
parted 命令
passwd 命令
perf 命令
pgrep 命令
pidof 命令
pidstat 命令
pinky 命令
pkill 命令
pm2 命令
printenv 命令
ps 命令
pstree 命令
pvdisplay 命令
pvs 命令
quota 命令
rbash 命令
reset 命令
rmmod 命令
sar 命令
snap 命令
stty 命令
sudo 命令
systemd-analyze 命令
testdisk 命令
timew 命令
top 命令
tree 命令
type 命令
ulimit 命令
unalias 命令
uname 命令
update-alternatives 命令
uprecords 命令
uptime 命令
vigr 命令
vipw 命令
vmstat 命令
w 命令
whoami 命令
zypper 命令
共收录到 549 个 Linux 命令